Amplitude Review (2026) — The Product Analytics Platform That 26% of the Fortune 100 Chose Over Everything Else

What we liked
- Full platform available on every plan including free — analytics, session replay, A/B testing, feature flags, CDP, and AI agents ship with the Starter tier, not locked behind enterprise paywalls
- Behavioral analytics depth surpasses Mixpanel and Google Analytics — retention segmentation by cohort entry behavior, 15+ report types, and pathfinding that surfaces feature interactions correlated with retention
- Agentic AI analytics (launched February 2026) deploys four specialized agents for dashboard monitoring, session replay analysis, experimentation, and feedback processing — autonomous insight generation, not just natural-language queries
- Session replay is tightly integrated with behavioral data — jump from a funnel drop-off directly to recordings of users who exhibited that exact behavior, even on the free plan
- 24 consecutive quarters ranked #1 in G2's Product Analytics category, with 4,900+ customers including 26% of the Fortune 100
What we didn't
- Enterprise and Growth pricing is fully custom with no published rates — teams cannot budget accurately without going through a sales conversation, and anonymized contract data shows $30,000 to $150,000+ annually for 100K-500K MTUs
- Free Starter plan caps at 10,000 monthly tracked users and 2 million events — generous for prototyping but insufficient for any product with meaningful traction
- Platform complexity creates a steep onboarding curve for non-technical marketers — the depth that product teams value becomes overhead for teams that need simpler funnel reports
- Web analytics capabilities lag behind Google Analytics — Amplitude excels at in-product behavioral analysis but lacks GA4's traffic attribution, SEO reporting, and advertising integration
- Experimentation features require thoughtful implementation — statistical methods (sequential testing, CUPED, multi-armed bandits) deliver rigorous results but demand more setup than simple A/B testing tools
Amplitude is the product analytics platform that 26% of the Fortune 100 chose to understand how users actually behave inside their products — and the one where most teams only scratch the surface of what behavioral cohorting, integrated experimentation, and agentic AI can do together.
No Varnish analyzed Amplitude's published documentation, aggregated G2 and Capterra reviews, current pricing structures, 2026 AI feature releases, and competitive positioning against Mixpanel and Google Analytics to determine whether Amplitude delivers enough depth to justify its enterprise pricing — or whether lighter alternatives cover the same ground at lower cost. No affiliate relationships. No vendor talking points. Just data.
The findings reveal a platform with genuine strengths (behavioral analytics depth, integrated experimentation, session replay on every plan) and real constraints (opaque enterprise pricing, steep onboarding curve, limited web analytics) that affect startups and enterprise teams in fundamentally different ways.
In this review, you'll learn:
- How Amplitude's behavioral analytics go deeper than funnel reports — and why retention segmentation by cohort entry behavior changes the analysis
- What the experimentation platform offers beyond basic A/B testing, including CUPED variance reduction and multi-armed bandits
- Where Amplitude's CDP fits in a stack that already includes dedicated data platforms
- How Amplitude's 2026 agentic AI compares to the AI features in Google Analytics and competing platforms
- Whether the free Starter plan is viable or a gateway to enterprise contracts that start at $30,000/year
Let's get into it.
What Do You Actually Get With Amplitude?
Amplitude is a digital analytics platform built for product teams, combining behavioral analytics, experimentation (A/B testing and feature flags), session replay, a customer data platform (CDP), and agentic AI agents — all within a single integrated system used by 4,900+ companies including Capital One, DoorDash, Atlassian, Notion, NBCUniversal, and Zillow. Founded in 2012 by Spenser Skates, Curtis Liu, and Jeffrey Wang, Amplitude went public on NASDAQ (ticker: AMPL) in September 2021 and reported 17% revenue growth in Q1 2026.
| Feature | Details |
|---|---|
| Category | Product & Behavioral Analytics |
| Our Rating | 4.4/5 |
| G2 Rating | 4.5/5 (3,081 reviews) |
| Capterra Rating | 4.6/5 |
| Best For | Enterprise product teams needing advanced behavioral analytics and experimentation |
| Customers | 4,900+ companies, 26% of Fortune 100 |
| Starting Price | Free (Starter: 10K MTUs, 2M events/month) |
| Plus Plan | $49/month (annual), 300K MTUs, 25M events/month |
| Growth / Enterprise | Custom pricing (sales required) |
| Key Capabilities | Behavioral Analytics, Experimentation, Session Replay, CDP, AI Agents |
How Deep Does Amplitude's Behavioral Analytics Go?
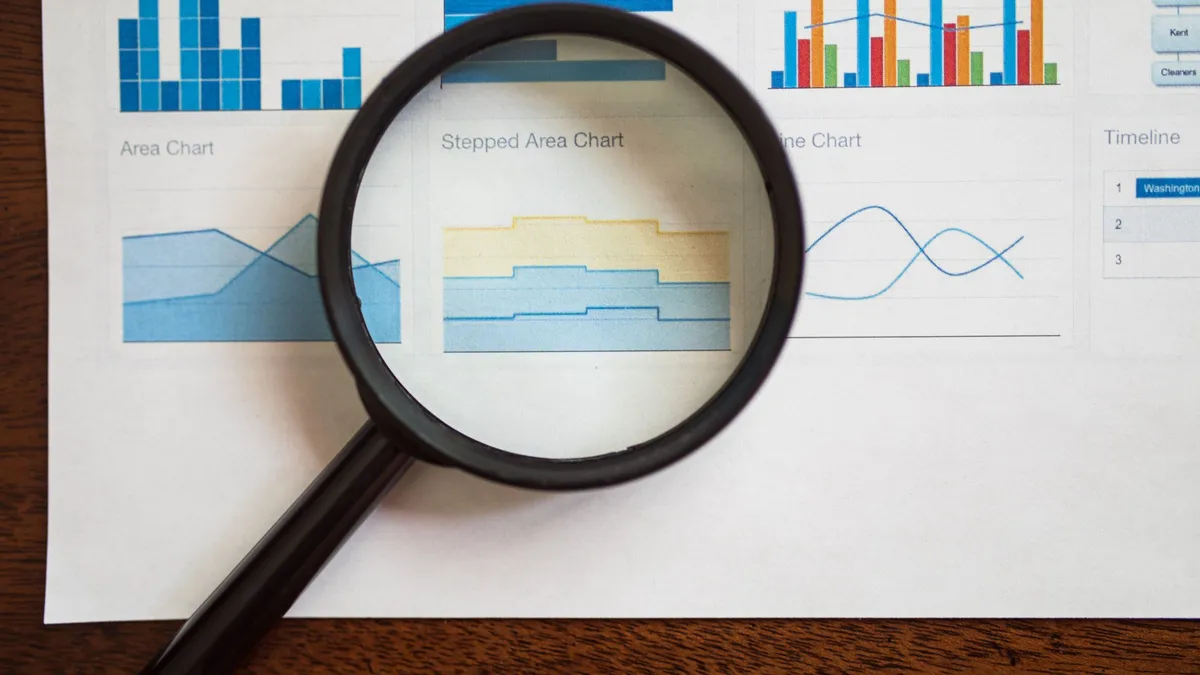
Amplitude's behavioral analytics capture every user interaction as an event and layer cohort analysis, retention segmentation, and pathfinding on top — going significantly deeper than the funnel-and-pageview model that defines most analytics platforms. The platform offers 15+ report types including capabilities that Google Analytics and Mixpanel do not match directly.
Amplitude's retention analysis allows segmentation by cohort entry behavior — tracking not just whether users return, but whether users who performed a specific action during their first session retain at higher rates than those who did not. Product teams use this to identify activation behaviors: the specific actions that predict long-term engagement. Pathfinding surfaces feature interactions that correlate with retention, revealing which product flows lead to conversion and which lead to churn.
For product managers, Amplitude's behavioral clustering groups users by actual usage patterns rather than demographic segments, surfacing user types that manual segmentation misses entirely. For data teams, the platform's event-based data model supports custom properties, computed metrics, and behavioral cohorting at a granularity that web analytics tools were never designed to handle. For growth teams, funnel analysis with conversion windows, segment comparisons, and drop-off diagnostics connects directly to experimentation — teams can identify where users drop off and launch an A/B test to address it without switching tools. Understanding customer lifetime value helps these teams quantify the revenue impact of retention improvements.
What Makes Amplitude's Experimentation Platform Stand Out?
Amplitude's experimentation platform integrates A/B testing and feature flags directly into the behavioral analytics workflow — experiments run against behavioral segments rather than random user samples, and results feed back into cohort analysis automatically. The statistical rigor goes beyond basic significance testing.

Amplitude supports sequential testing (monitor results as data accumulates without inflating false positive rates), CUPED variance reduction (uses pre-experiment data to reduce noise, detecting smaller effects with the same sample size), and multi-armed bandits (automatically shift traffic toward winning variants during the experiment). Web experimentation includes a visual editor for running experiments directly on websites or single-page apps without code changes.
For enterprise product teams, the tight integration between experimentation and behavioral analytics means experiment results are not just "Variant B had a 3% lift in clicks" — Amplitude shows how the variant affected downstream behaviors like retention, feature adoption, and revenue. For smaller teams running their first experiments, the guided setup walks through hypothesis, metrics, audience selection, and statistical configuration step by step. Teams evaluating whether experimentation generates positive returns can model the impact with an ROI calculator.
Amplitude's February 2026 strategic partnership with Statsig expanded the experimentation footprint further, incorporating Statsig's infrastructure across cloud and data warehouse deployments.
How Does Amplitude's Customer Data Platform Work?
Amplitude CDP is an insights-driven customer data platform that identifies users, builds behavioral segments, and syncs audience data to 150+ destinations — integrating identity resolution and audience activation directly into the analytics workflow rather than requiring a separate CDP vendor.
Amplitude CDP collects data from web, mobile, and server-side sources, resolves user identities across devices, and builds segments based on behavioral criteria (not just demographic attributes). Segments sync to advertising platforms, email tools, CRM systems, and data warehouses — enabling product-qualified lead scoring, behavioral email triggers, and personalized ad targeting based on actual product usage patterns rather than inferred intent.
For teams already using Segment or mParticle, Amplitude CDP overlaps significantly but adds the behavioral analytics layer that standalone CDPs lack. The tradeoff: Amplitude's CDP is purpose-built for product analytics use cases, not the broader data routing that dedicated CDPs handle. For teams without a CDP, Amplitude provides identity resolution and audience sync within the existing analytics subscription, eliminating the need for a separate vendor. For email marketing teams, CDP segments based on product behavior can trigger campaigns in tools like Klaviyo or ActiveCampaign — users who completed onboarding but haven't returned in 7 days, users who hit a paywall three times, or users whose usage dropped below their cohort average.
How Much Does Amplitude Cost in 2026?
Amplitude's pricing spans four tiers from free to custom enterprise contracts, with the Plus plan at $49/month representing the only publicly listed paid price. Growth and Enterprise pricing requires a sales conversation, and anonymized contract data shows annual values ranging from $30,000 to $150,000+ for teams with 100,000 to 500,000 monthly tracked users.
| Plan | Price | MTUs | Events/Month | Key Additions |
|---|---|---|---|---|
| Starter (Free) | $0 | 10,000 | 2 million | Full platform access, unlimited seats, session replay, A/B tests, feature flags, AI agents |
| Plus | $49/month (annual) | 300,000 | 25 million | Advanced analytics, higher limits |
| Growth | Custom | Custom | Custom | SSO, project permissions, real-time streaming, causal insights |
| Enterprise | Custom | Unlimited | Custom | Dedicated support, CSM, RBAC, custom data retention, SLAs |

Amplitude's Starter plan is the most generous free tier in product analytics. Every Amplitude plan — including free — gives access to the full platform: analytics, session replay, experimentation, web experimentation, CDP, guides, surveys, and AI agents. Starter limits volume (10K MTUs, 2M events) but does not gate features behind paywalls. Mixpanel's free plan offers 1 million events and 10,000 session replays but lacks experimentation. Google Analytics offers unlimited standard reports for free but lacks product analytics depth entirely.
The pricing opacity problem is real. Growth and Enterprise pricing is entirely custom, and Amplitude does not publish even ballpark ranges. Anonymized buyer data from procurement platforms shows wide variance — teams report annual contracts from $30,000 for mid-market deployments to $150,000+ for enterprise-scale implementations. The lack of published pricing makes budgeting difficult for teams evaluating Amplitude against alternatives with transparent pricing like Mixpanel.
How Does Amplitude Compare to Mixpanel and Google Analytics?
Amplitude leads on behavioral depth and experimentation rigor; Mixpanel wins on funnel simplicity and pricing transparency; Google Analytics dominates web traffic analysis and advertising integration. The three platforms serve overlapping but distinct analytical needs.
| Dimension | Amplitude | Mixpanel | Google Analytics |
|---|---|---|---|
| Starting Price | Free (10K MTUs) | Free (1M events/mo) | Free (unlimited standard reports) |
| G2 Rating | 4.5/5 (3,081 reviews) | 4.6/5 | 4.5/5 (6,708 reviews) |
| Primary Strength | Behavioral analytics + experimentation | Funnel analysis + event tracking | Web analytics + Google Ads integration |
| Session Replay | Integrated (all plans) | Included (all tiers) | Not built-in |
| Experimentation | Built-in (CUPED, bandits, sequential) | Limited | None |
| CDP | Integrated | Not built-in | Not built-in |
| Best For | Enterprise product teams | SaaS product teams | Web traffic + ad optimization |
Amplitude vs Mixpanel is the core decision for product teams. Amplitude offers deeper behavioral analysis — retention segmentation by entry behavior, 15+ report types, and integrated experimentation. Mixpanel provides more intuitive funnel building with drag-and-drop simplicity and transparent per-event pricing. Amplitude's session replay integration is more tightly coupled to behavioral analytics — jumping from a funnel drop-off directly to recordings of users who exhibited that exact behavior, whereas Mixpanel's session replay operates as a standalone feature with AI-generated summaries. For comprehensive analytics coverage across the full marketing stack, the best AI analytics tools guide compares all major options.
Amplitude vs Google Analytics is not an either/or decision for most SaaS businesses. GA4 handles web analytics, traffic attribution, and Google Ads optimization at a depth Amplitude cannot match. Amplitude handles in-product behavioral analysis, experimentation, and session replay at a depth GA4 was never designed for. The practical architecture: GA4 for acquisition (traffic, landing pages, ad performance) and Amplitude for activation and retention (user behavior, feature adoption, A/B testing). Behavioral tools like Hotjar complement both by adding heatmaps and qualitative feedback.
What AI Features Set Amplitude Apart in 2026?
Amplitude introduced agentic AI analytics in February 2026 — four autonomous agents that continuously analyze product usage, detect anomalies, review user sessions, and process feedback without requiring manual queries. The approach goes beyond the natural-language question-answering that most analytics platforms offer.
The Global Agent allows teams to ask complex questions in plain language and receive answers that span funnels, experiments, segments, and user journeys — then recommends actions and can execute them directly within Amplitude. The Dashboard Monitoring Agent detects meaningful metric changes within hours, investigates root causes, and delivers insights via Slack or email. The Session Replay Agent reviews hundreds of user sessions continuously, identifies friction patterns, quantifies revenue impact, and recommends specific fixes. The Experimentation Agent automates experiment analysis and surfaces insights that manual review would miss.
For product leaders, agentic analytics means anomalies surface proactively rather than waiting for someone to notice a metric decline during a weekly review. For data analysts, the AI handles the routine monitoring that consumes hours weekly, freeing time for deeper strategic analysis. For developers, Amplitude's AI integrations with Cursor, Claude Code, and GitHub add behavioral context directly into development workflows — pull requests annotated with impact data, not just code changes.
Who Should Use Amplitude?
Amplitude serves three primary audiences — and the right fit depends on team size, analytical maturity, and whether experimentation is a core workflow or an occasional need.
If you're a product team at a growth-stage SaaS company, Amplitude's behavioral analytics and experimentation integration are purpose-built for your workflow. Identifying activation behaviors, running experiments to improve them, and tracking retention cohorts is Amplitude's core strength. Start with Starter if you have fewer than 10K MTUs; budget for Growth when volume exceeds Plus limits.
If you're an enterprise with multiple product teams, Amplitude's governance features (SSO, RBAC, project permissions) and Growth/Enterprise SLAs provide the organizational controls that Mixpanel's simpler structure does not. The CDP's ability to sync behavioral segments to 150+ destinations makes Amplitude a hub for product-led growth strategies. The AI marketing tool pricing index contextualizes where Amplitude's enterprise pricing falls relative to the broader marketing tool market.
If you're a small business or marketing team focused on web analytics, Amplitude is likely more than you need. Google Analytics covers web traffic, conversions, and ad optimization for free. Pair GA4 with Hotjar for heatmaps and recordings — the combination costs less than Amplitude's Plus plan and serves marketing-focused use cases more directly.
Is Amplitude Worth It in 2026?
Based on independent analysis of 3,081 G2 reviews, Capterra ratings, published documentation, current pricing, and 2026 feature releases, Amplitude earns a 4.4/5 rating. Amplitude is the most capable product analytics platform available — ranked #1 in G2's Product Analytics category for 24 consecutive quarters — with behavioral depth, integrated experimentation, and agentic AI that no competitor matches in a single platform.
Rating: 4.4/5 (assessed July 2026 — reflects 2026 agentic AI features and full-platform Starter tier)
Amplitude's defining advantage is integration depth. Behavioral analytics, experimentation, session replay, and CDP within one platform means insights flow between capabilities without the data stitching and tool-switching that fragmented stacks require. The Starter plan's access to the full platform — not just analytics, but experimentation, feature flags, session replay, and AI agents — is the most generous free tier in product analytics.
The enterprise pricing opacity is Amplitude's most significant weakness for buyers. Growth and Enterprise pricing is entirely custom with no published benchmarks, and the gap between Plus at $49/month and anonymized enterprise contracts at $30,000-$150,000/year leaves a wide uncertainty range. Teams evaluating Amplitude against Mixpanel's transparent pricing or Google Analytics' free tier face a budgeting challenge that only a sales conversation can resolve.
The 2026 agentic AI launch positions Amplitude ahead of competitors on autonomous analytics — proactive anomaly detection, continuous session review, and automated experiment analysis go beyond the reactive natural-language querying most platforms offer. Whether that AI advantage justifies enterprise pricing depends on team size and analytical maturity.
Amplitude earned 4.5/5 on G2 (3,081 reviews) and 4.6/5 on Capterra. The platform that 26% of the Fortune 100 chose delivers on its promise of behavioral depth — the question is whether your team needs that depth or whether lighter tools cover the same ground at a fraction of the cost.
Frequently Asked Questions
Is Amplitude's free plan good enough for startups? Amplitude's Starter plan is genuinely free with no time limit and no credit card required — 10,000 MTUs and 2 million events per month with access to the full platform including analytics, session replay, A/B testing, feature flags, and AI agents. For pre-launch products and early-stage startups with fewer than 10K monthly users, Starter covers every essential capability. Teams that outgrow the limits can upgrade to Plus at $49/month for 300K MTUs and 25M events.
How does Amplitude compare to Mixpanel? Amplitude leads on behavioral depth — retention segmentation by cohort entry behavior, 15+ report types, integrated session replay, and experimentation built into the analytics workflow. Mixpanel wins on funnel simplicity with a more intuitive drag-and-drop interface and transparent per-event pricing. Amplitude's free tier is more limited (10K MTUs vs Mixpanel's 1M events). For teams that prioritize experimentation and behavioral cohorting, Amplitude is the stronger choice; for teams that need straightforward funnel analysis with predictable costs, Mixpanel fits better.
Does Amplitude replace Google Analytics? Amplitude does not replace Google Analytics for most businesses. GA4 handles web traffic attribution, SEO reporting, and Google Ads integration — capabilities Amplitude does not match. Amplitude excels at in-product behavioral analytics, experimentation, and session replay. The practical setup for SaaS companies: GA4 for the top of the funnel (traffic sources, landing page performance, acquisition) and Amplitude for everything after login (user behavior, retention, feature adoption, A/B testing).
Sources
- Amplitude — Platform overview, product capabilities, and company information
- Amplitude Pricing — Starter, Plus, Growth, and Enterprise plan details
- G2 Amplitude Analytics Reviews — 4.5/5 from 3,081 verified reviews
- Capterra Amplitude Reviews — 4.6/5 verified rating
- Amplitude Customers — 4,900+ companies, 26% of Fortune 100
- Amplitude Agentic AI Announcement — February 2026 launch of autonomous analytics agents
- Amplitude Q1 2026 Financial Results — 17% revenue growth
- Amplitude G2 #1 Ranking — 24 consecutive quarters at #1 in Product Analytics
- Amplitude CDP — Insights-driven customer data platform with 150+ destination syncs
Where Can I Learn More?
These related articles provide deeper coverage of specific topics discussed in this review.
- Best AI Analytics Tools (2026) — How Amplitude, Google Analytics, Mixpanel, and Hotjar compare across features and pricing.
- Analytics Tools Guide — Our complete guide to analytics platforms across every category and price point.
- Google Analytics Review — Deep dive into the web analytics platform most teams pair with Amplitude for full-funnel coverage.
- Hotjar Review — How heatmaps and session recordings complement Amplitude's behavioral analytics.
- AI Marketing Tool Pricing Index (2026) — Where Amplitude's pricing falls relative to the broader marketing tool market.
- AI Tool Adoption Rates (2026) — How quickly businesses are adopting product analytics and experimentation platforms.
- AI Tool ROI Calculator — Calculate whether Amplitude's enterprise pricing generates positive returns at your scale.
Frequently Asked Questions
You Might Also Like
best
5 Analytics Tools Startups Actually Need in 2026 — 4 Are Completely Free
Mixpanel, Amplitude, PostHog, GA4, and Hotjar compared for startups. Free tiers, VC-ready metrics, startup programs, and which stack to build at each stage.
14 min read · Jul 21, 2026
data
Zero-Click Search Statistics 2026: 68% of Google Searches Now End Without a Click
Zero-click search statistics 2026: 68.01% of Google searches produce no click. Data on AI Overviews, publisher traffic losses, and what marketers should do.
24 min read · Jul 20, 2026
insights
Share of Model: The AI Visibility Metric 45% of Marketers Can't Even Measure Yet
Share of Model measures how often AI platforms recommend your brand vs competitors. With 45B monthly AI sessions, this metric reshapes marketing measurement.
18 min read · Jul 19, 2026
data
AI Marketing Tool Pricing Index: 3 Plans Killed, 2 New Fees — July 2026
Monthly pricing tracker for 28 AI marketing tools across SEO, content, email, ads, analytics, and CRM. July 2026 update: Jasper, Copy.ai, and Writesonic eliminated their cheapest plans while Meta and Google added hidden fees.
17 min read · Jul 17, 2026
Was this helpful?
SEO & Digital Marketing Specialists
A team of SEO professionals and Google Ads specialists with deep experience managing campaigns for e-commerce brands. Every tool on this site is independently analyzed using published data, aggregated user reviews, and documented performance metrics.
Report an error in this article →Get the unvarnished truth.
Every Tuesday.
One email a week. New tool reviews, head-to-head verdicts, and trend analysis — based on real data, not vendor press releases. Free. No spam. Unsubscribe anytime.