Mixpanel Review (2026) — 8,000+ Companies Rely on It, but the Real Cost Isn't on the Pricing Page

What we liked
- Free plan includes 1 million monthly events with unlimited seats, 10K session replays, and 30 Spark AI queries — one of the most generous free tiers in product analytics
- Funnel analysis is faster to build and easier to interpret than Amplitude or Google Analytics — conversion rate tables update in real time without full page reloads
- Spark AI lets teams query analytics data in natural language, generating Insights, Funnels, Retention, and Flows reports without writing SQL or learning the query builder
- Warehouse connectors sync bidirectionally with Snowflake, BigQuery, Databricks, Redshift, and Postgres — teams can power Mixpanel with governed warehouse data instead of raw SDK events
- Session replay now included across all tiers (10K–20K+ monthly replays) with AI-generated summaries, covering web, iOS, Android, and React Native
What we didn't
- Pricing scales aggressively after the free tier — Growth plan charges $0.28 per 1,000 events, meaning 10M monthly events costs approximately $2,520/month
- Initial event tracking implementation requires careful planning — misconfigured events or properties create data quality issues that compound over time and are difficult to fix retroactively
- Web traffic analytics are significantly weaker than Google Analytics — Mixpanel is designed for in-product behavior, not acquisition channels, SEO performance, or advertising attribution
- Enterprise pricing is opaque — contracts typically start at $25,000–$30,000/year but are individually negotiated, making cost comparison difficult
- Free plan limits change frequently — Mixpanel has restructured pricing multiple times since 2022, creating confusion about what's actually included at each tier
Mixpanel is the product analytics platform that 8,000+ companies — including Uber, BMW, Intuit, and Samsung — use to track what users actually do inside their products, not just how they arrive at the website.
No Varnish analyzed Mixpanel's published documentation, aggregated G2 and Capterra reviews, current pricing structures, 2026 feature releases, and warehouse integration capabilities to determine whether Mixpanel delivers enough depth in 2026 to justify its price — especially as costs scale well beyond the generous free tier. No vendor talking points. No affiliate-inflated praise. Just data.
The findings reveal a platform with genuine strengths (event analytics depth, Spark AI, session replay) and real weaknesses (aggressive pricing at scale, weak web traffic analytics) that affect startups and enterprise teams in very different ways.
In this review, you'll learn:
- How Mixpanel's event-based analytics compare to Google Analytics and Amplitude on documented metrics
- Where Spark AI and session replay change the daily workflow for product and growth teams
- Why costs climb from $0 to $2,500+/month faster than most teams expect
- Which teams get genuine value from Mixpanel — and which are better served by other analytics tools
Let's get into it.
What Does Mixpanel Actually Do?
Mixpanel is a product analytics platform built on event-based tracking that captures every user interaction — button clicks, feature usage, purchases, sign-ups, and custom actions — and translates that behavioral data into funnels, retention curves, user flows, and cohort analyses. Founded in 2009 by Suhail Doshi and Tim Trefren through Y Combinator, Mixpanel is now led by CEO Jen Taylor (appointed September 2025, formerly President at Plaid and CPO at Cloudflare).
| Feature | Details |
|---|---|
| Category | Product Analytics Platform |
| Our Rating | 4.4/5 |
| G2 Rating | 4.6/5 (1,371 reviews) |
| Best For | Product teams at SaaS and tech companies tracking user engagement and retention |
| Customers | 8,000+ including Uber, BMW, Intuit, Samsung, Airbnb |
| Starting Price | Free (up to 1M events/month, unlimited seats) |
| Growth Plan | From $0.28/1K events (first 1M included) |
| Enterprise | Custom pricing (typically $25K–$30K+/year) |
| Key AI Features | Spark AI (natural-language analytics), AI replay summaries, Magic Playlists, MCP Server |
| Capterra Rating | 4.5/5 (145 reviews) |

How Does Mixpanel's Event-Based Architecture Track Product Behavior?
Mixpanel's event-based architecture captures every user action as a discrete event with attached properties — metadata describing the context of that interaction. A "Video Played" event might carry properties like video title, duration watched, user plan tier, and device type. Mixpanel organizes this data around three core entities: events (what happened), properties (the context), and user profiles (who did it).
For product teams, Mixpanel's event model enables tracking of specific feature interactions that page-view-based analytics tools miss entirely. Google Analytics can tell a team that 5,000 users visited the dashboard page; Mixpanel can tell the same team that 3,200 users created a report, 1,800 exported data, and only 400 used the advanced filter — with breakdowns by plan tier, company size, and user role.
For growth marketers, Mixpanel connects acquisition to activation. Teams can track whether users from a specific campaign actually complete onboarding steps, use core features, and convert to paid — not just whether they signed up. Measuring which acquisition channels produce the highest customer lifetime value becomes straightforward when Mixpanel tracks the full post-signup journey.
For startups, Mixpanel's free tier — 1 million monthly events with unlimited seats — provides enterprise-grade event analytics without a budget commitment. The free plan includes core analytics, 5 saved reports, and 10,000 monthly session replays. Early-stage teams can validate product-market fit with behavioral data before committing to a paid tier.
How Powerful Are Mixpanel's Funnel and Retention Reports?
Mixpanel's funnel analysis lets teams define multi-step conversion paths, measure drop-off at each stage, and segment results by any user property or behavioral attribute — all without SQL or data engineering support. Funnel reports update in real time as steps are modified, and conversion rate tables render without full page reloads, making iterative analysis faster than competing platforms.
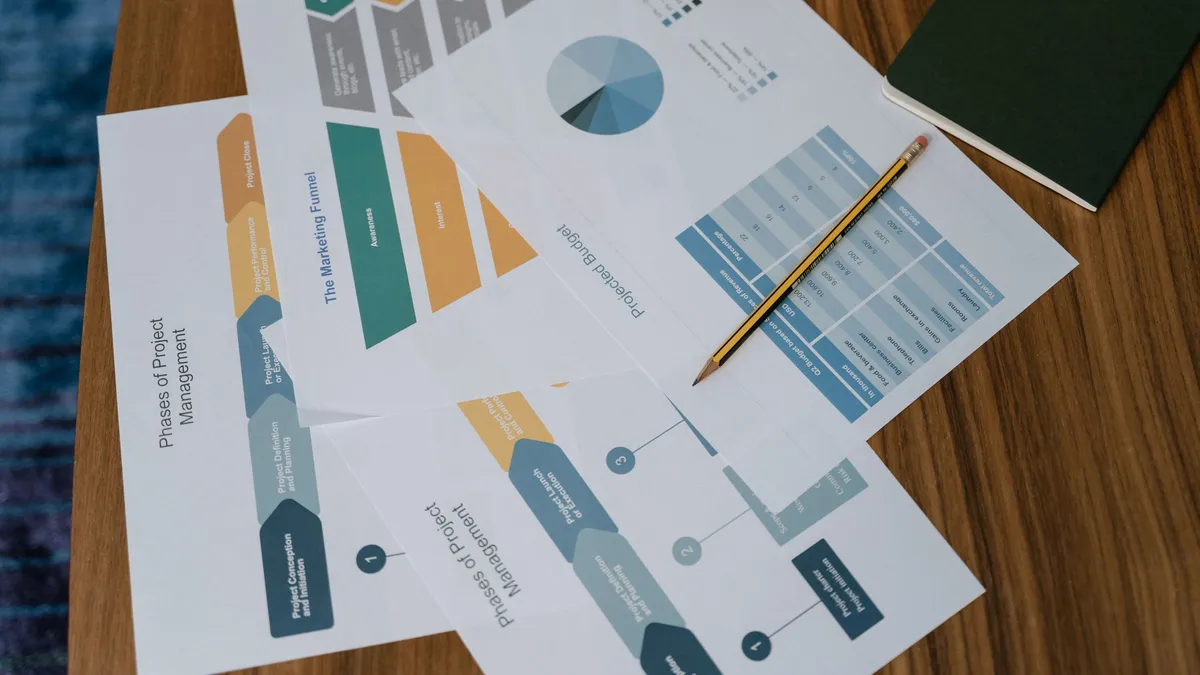
Mixpanel's retention analysis measures how consistently users return to perform specific actions over time. Retention curves visualize whether engagement holds or decays, broken down by cohort, acquisition source, plan tier, or any custom property. For product teams, retention curves reveal whether a new feature launch actually changes long-term engagement or just produces a temporary spike. For growth marketers, retention data identifies which onboarding flows produce the stickiest users — directly informing where to invest acquisition spend.
User Flows visualize the actual paths users take through a product, revealing navigation patterns that pre-defined funnels cannot capture. Flows show where users deviate from expected journeys, which features they discover organically, and where unexpected drop-offs occur. Combined with cohort analysis — grouping users by shared characteristics or behaviors and tracking their outcomes over time — Mixpanel provides a behavioral analytics depth that standard web analytics tools are not designed to deliver.

What Does Spark AI Add to Mixpanel's Analytics?
Spark is Mixpanel's natural-language analytics engine, allowing teams to query product data by typing questions like "What's the conversion rate from sign-up to first report created this month?" or "Which user segments have the highest 30-day retention?" Spark generates the corresponding Insights, Funnels, Retention, or Flows report automatically — complete with the right chart type, filters, and breakdowns.
For product teams without dedicated analysts, Spark eliminates the learning curve of Mixpanel's query builder. Teams can unlock advanced features — Aggregate Properties (average session length), Custom Buckets (specific user segments), and Behavioral Breakdowns (interaction patterns) — through natural language instead of configuration menus. Spark's follow-up capability lets teams drill deeper into any generated report by asking refinement questions, building an iterative analysis workflow conversationally.
For enterprise data teams, Mixpanel's MCP Server connects directly to Claude, ChatGPT, and Cursor, enabling conversational analytics queries from tools teams already use daily. The MCP Server integration transforms Mixpanel from a standalone dashboard into a data layer accessible through any AI assistant that supports the Model Context Protocol.
Spark availability scales by tier: Free plans get 30 queries per month, Growth plans get 60, and Enterprise plans get 300. Mixpanel does not use customer data to train third-party AI models — Spark queries are processed without saving data externally.
How Much Does Mixpanel Cost in 2026?
Mixpanel's free plan includes 1 million monthly events with unlimited seats — genuinely generous for early-stage products. The Growth plan charges $0.28 per 1,000 events above the included 1M, with costs scaling based on volume. Enterprise pricing is custom, typically starting at $25,000–$30,000 per year.

| Plan | Price | Monthly Events | Session Replays | Spark AI Queries | Saved Reports |
|---|---|---|---|---|---|
| Free | $0 | 1M (access limited after) | 10K | 30/month | 5 |
| Growth | From $0.28/1K events | 1M included + pay-per-event | 20K | 60/month | Unlimited |
| Enterprise | Custom ($25K–$30K+/year) | Unlimited | Custom | 300/month | Unlimited |
The real cost story is the scaling curve. Mixpanel's free tier covers most early-stage SaaS products comfortably. But growth creates a pricing cliff: 5 million monthly events costs approximately $1,120/month, 10 million events costs approximately $2,520/month, and 50 million events reaches approximately $13,720/month. For startups, the free tier is a genuine runway extender. For mid-market teams, the jump from free to meaningful Growth plan spend happens faster than most budget cycles anticipate. Use the AI tool ROI calculator to model whether Mixpanel's behavioral insights generate enough incremental product improvement to justify the cost at your event volume.
Mixpanel switched from MTU-based (monthly tracked users) to event-based pricing in February 2026 for all new customers. Existing customers on MTU plans can remain or migrate. The shift makes pricing more predictable for products with few users generating many events, but more expensive for products with many users generating few events each.
How Does Mixpanel Compare to Amplitude and Google Analytics?
Mixpanel leads on funnel simplicity and pricing transparency; Amplitude leads on behavioral depth and experimentation; Google Analytics leads on web traffic analysis and advertising integration. Most SaaS businesses pair two of these tools rather than relying on one.
| Dimension | Mixpanel | Amplitude | Google Analytics |
|---|---|---|---|
| Starting Price | Free (1M events) | Free (limited) | Free (unlimited standard reports) |
| G2 Rating | 4.6/5 (1,371 reviews) | 4.5/5 | 4.5/5 (6,708 reviews) |
| Primary Strength | Product analytics + funnels | Behavioral analytics + experimentation | Web analytics + ad optimization |
| Session Replay | Included (all tiers) | Integrated (all plans) | Not available |
| AI Features | Spark AI (NL queries) | AI-powered insights | Analytics Advisor (Gemini) |
| Best For | SaaS product teams | Enterprise product orgs | Web traffic + Google Ads |
| Pricing Model | Event-based ($0.28/1K) | Custom negotiation | Free / GA360 from $50K/yr |
Mixpanel vs Amplitude is the most common decision for SaaS product teams. Mixpanel's funnels are faster to build, the interface is more accessible for engineering-led teams, and pricing is publicly documented. Amplitude's behavioral graphs go deeper — predictive churn signals, feature correlation analysis, and built-in A/B testing via Amplitude Experiment are capabilities Mixpanel does not match. For teams prioritizing speed and simplicity, Mixpanel is the stronger choice. For teams prioritizing experimentation rigor, Amplitude delivers more analytical depth.
Mixpanel vs Google Analytics is not a direct competition — the tools serve different analytical layers. Google Analytics tracks web traffic, acquisition channels, and advertising performance. Mixpanel tracks in-product user behavior after the website visit. SaaS businesses that track how users find their product (GA4) and what users do inside their product (Mixpanel) get a complete picture. Businesses that need qualitative behavior data — heatmaps, recordings, user feedback — should add Hotjar as a third layer, since neither Mixpanel's session replay nor GA4 covers page-level interaction patterns as deeply.
Which Teams Should Choose Mixpanel?
SaaS product teams get the most value from Mixpanel. Tracking feature adoption, measuring onboarding completion, analyzing retention by cohort, and identifying conversion bottlenecks are Mixpanel's core strengths. The platform is built for the question "what are users doing inside our product?" — not "how did users find our website?"
Growth-stage startups benefit from Mixpanel's free tier through early product-market fit validation, then face a genuine pricing decision as event volume scales. Teams should budget for the Growth plan transition before hitting 1M monthly events to avoid disruption.
Enterprise product organizations should evaluate Mixpanel against Amplitude based on experimentation needs. Mixpanel is the better fit for teams that need fast, self-serve funnel and retention analysis. Amplitude is the better fit for teams running rigorous behavioral experiments across multiple product surfaces. Enterprise pricing for both platforms requires direct negotiation — the AI marketing tool pricing index provides broader context on how analytics costs compare across the marketing stack.
Marketing-only teams without product analytics needs should start with Google Analytics, not Mixpanel. GA4's web traffic analysis, Google Ads integration, and predictive audiences serve marketing use cases that Mixpanel does not address.
Is Mixpanel Worth It in 2026?
Based on analysis of 1,371 G2 reviews, 145 Capterra reviews, published documentation, current pricing, and 2026 feature releases, Mixpanel earns a 4.4/5 rating. Mixpanel is the strongest product analytics platform for SaaS teams that need behavioral depth beyond web traffic — but pricing at scale remains the primary concern that teams must plan for before event volumes grow.
Rating: 4.4/5 (assessed July 2026 — reflects Spark AI, session replay expansion, and event-based pricing model)
Mixpanel's position in product analytics is well-earned. The funnel analysis is faster and more intuitive than competing platforms. Retention curves with cohort breakdowns provide genuine product intelligence. Spark AI lowers the analytics barrier for teams without dedicated data analysts. Session replay — now included across all tiers with AI-generated summaries — closes a gap that previously required a separate tool like Hotjar. Warehouse connectors bringing governed data from Snowflake and BigQuery into Mixpanel mean teams can power analytics with trusted, centralized data rather than raw SDK instrumentation alone.
The pricing curve is Mixpanel's clearest weakness. The free tier is genuinely generous at 1M monthly events. But the $0.28-per-1,000-events Growth model means costs accelerate faster than linear — a product tracking 10M monthly events pays over $2,500/month, and 50M events exceeds $13,000/month. Teams that track AI tool adoption rates across their marketing stack know that analytics costs at scale demand careful ROI justification.
Mixpanel earned 4.6/5 on G2 (1,371 reviews) and 4.5/5 on Capterra (145 reviews). For SaaS product teams that need to understand user behavior beyond pageviews, Mixpanel remains the clearest choice — provided the team budgets for where event-based pricing actually lands, not just where it starts.
Frequently Asked Questions
Is Mixpanel free? Yes, Mixpanel offers a free plan that includes 1 million monthly events, unlimited seats, 5 saved reports, 10,000 monthly session replays, and 30 Spark AI queries per month — no credit card required. Platform access is limited once you exceed 1M events; Mixpanel does not charge overages on the free tier. The Growth plan starts at $0.28 per 1,000 events with the first 1M events included free.
Should I use Mixpanel or Google Analytics? Most SaaS businesses should use both. Google Analytics handles web traffic analysis, acquisition channels, and Google Ads optimization — areas where Mixpanel offers minimal coverage. Mixpanel handles in-product behavior tracking, funnel analysis, retention curves, and user segmentation — areas where GA4 lacks depth. Use GA4 for the top of the funnel (traffic, signups, trial starts) and Mixpanel for everything after login.
How does Mixpanel compare to Amplitude? Mixpanel offers faster, simpler funnel building and more transparent pricing. Amplitude offers deeper behavioral analytics, built-in A/B testing (Amplitude Experiment), and predictive churn modeling. Mixpanel is better for engineering-led product teams that want to move fast. Amplitude is better for enterprise product organizations that need rigorous cross-team experimentation and governance. Mixpanel's Growth plan pricing is public; Amplitude's enterprise pricing requires negotiation.
Where Can I Learn More?
These related articles provide deeper coverage of specific topics discussed in this review.
- Best AI Analytics Tools (2026) — How Mixpanel, Google Analytics, Amplitude, and Hotjar compare across features and pricing.
- Analytics Tools Guide — Our complete guide to analytics platforms across every category and price point.
- Google Analytics Review — Deep dive into the web analytics platform that pairs most naturally with Mixpanel for SaaS businesses.
- Hotjar Review — Heatmaps, session recordings, and user feedback — the qualitative layer Mixpanel's replay feature partially overlaps.
- AI Marketing Tool Pricing Index (2026) — Where Mixpanel's event-based pricing falls relative to the broader marketing tool market.
- AI Tool Adoption Rates (2026) — How quickly businesses are adopting AI-powered analytics and marketing tools.
- AI Tool ROI Calculator — Calculate whether Mixpanel's Growth plan pricing pays for itself at your event volume.
Sources
- Mixpanel — Product analytics platform, features, and documentation
- Mixpanel Pricing — Free, Growth, and Enterprise plan details and event-based pricing model
- Mixpanel Spark AI — Natural-language analytics, AI summaries, and MCP Server documentation
- Mixpanel Session Replay — Web, iOS, Android, and React Native session replay with AI summaries
- Mixpanel Warehouse Connectors — Snowflake, BigQuery, Databricks, Redshift, and Postgres integration
- Mixpanel Data Governance — Event and property management, data quality controls
- G2 Mixpanel Reviews — 4.6/5 from 1,371 verified reviews
- Capterra Mixpanel Reviews — 4.5/5 from 145 verified reviews
- Mixpanel G2 Badges Summer 2026 — 88 badges including #1 Mid-Market Usability for Product Analytics
- Mixpanel CEO Appointment — Jen Taylor appointed CEO September 2025
Frequently Asked Questions
You Might Also Like
best
5 Analytics Tools Startups Actually Need in 2026 — 4 Are Completely Free
Mixpanel, Amplitude, PostHog, GA4, and Hotjar compared for startups. Free tiers, VC-ready metrics, startup programs, and which stack to build at each stage.
14 min read · Jul 21, 2026
data
Zero-Click Search Statistics 2026: 68% of Google Searches Now End Without a Click
Zero-click search statistics 2026: 68.01% of Google searches produce no click. Data on AI Overviews, publisher traffic losses, and what marketers should do.
24 min read · Jul 20, 2026
insights
Share of Model: The AI Visibility Metric 45% of Marketers Can't Even Measure Yet
Share of Model measures how often AI platforms recommend your brand vs competitors. With 45B monthly AI sessions, this metric reshapes marketing measurement.
18 min read · Jul 19, 2026
data
AI Marketing Tool Pricing Index: 3 Plans Killed, 2 New Fees — July 2026
Monthly pricing tracker for 28 AI marketing tools across SEO, content, email, ads, analytics, and CRM. July 2026 update: Jasper, Copy.ai, and Writesonic eliminated their cheapest plans while Meta and Google added hidden fees.
17 min read · Jul 17, 2026
Was this helpful?
SEO & Digital Marketing Specialists
A team of SEO professionals and Google Ads specialists with deep experience managing campaigns for e-commerce brands. Every tool on this site is independently analyzed using published data, aggregated user reviews, and documented performance metrics.
Report an error in this article →Get the unvarnished truth.
Every Tuesday.
One email a week. New tool reviews, head-to-head verdicts, and trend analysis — based on real data, not vendor press releases. Free. No spam. Unsubscribe anytime.